
- removed comment
Before each release, check that http://einsteintoolkit.org/gallery/ns/index.html still works and produces correct output using the current development code:
curl -kLO https://raw.githubusercontent.com/gridaphobe/CRL/master/GetComponents
chmod a+x GetComponents
./GetComponents --parallel --shallow https://bitbucket.org/einsteintoolkit/manifest/raw/master/einsteintoolkit.th

pip install --user -U kuibit
Then upload the results file to https://bitbucket.org/einsteintoolkit/www/downloads/
Then update https://bitbucket.org/einsteintoolkit/www/src/master/gallery/ns/ with updated image files and updating index.html
Keyword: None
The failures are caused by #2182
Reopen after ET_2019_03 release.

following up on your email, I would suggest to use option 2 (static_tov.par) for the gallery example. If you agree I will ask Giuseppe to run it and upload the corresponding plots.
Currently we have two different setups in the tutorial and gallery. Newbies like my students may find that confusing, especially because the results don't match. Therefore, I suggest to either use the same parameter file or adding a note in both.
We updated the parfile in the repo recently to Bruno's shortened version which is closer to what is currently on the gallery. Note that Bruno's is very very short and only useful for tutorial where the short runtime of ~10 minutes beats all considerations of being a sensible parfile otherwise. See #2243 and comment https://bitbucket.org/einsteintoolkit/tickets/issues/2243/use-bruno-giacomazzos-tov-parfile-from#comment-51464681
This means that he results not (qualitatively match), thankfully getting rid of the confusion though it still persists with respect to the data in the original GRHydro paper. If we desire to remove that confusion as well we should change both the tutorial and the gallery to 2d_Poltytrope.
After some more discussion, we decided the following: - update the gallery example to evolve a polytropic eos (2d_Polytrope), i.e., as close as possible to the 2011 paper. This will have a large grid + resolution (similar to static_tov.par) - for consistency: update the tutorial with that same physical setup, but with lower resolution and smaller grid size. Giuseppe is looking into this now.
on behalf of G. Ficarra:
In order to get the results obtained by https://arxiv.org/abs/1111.3344 (Figure 15), I have modified the parameter file static_tov.par (Cactus/par/static_tov.par) to make it as similar as possible to the original parameter file tov.rpar (Cactus/par/arXiv-1111.3344/tov/tov.rpar) which should give the results of the paper. At a first glance both parameter files describe the same physical system. The differences between them are given by the use of the dissipation and the poison value used in the process.
First, I have run simulations to test if using dissipation led to different results. Using both resolutions dx=8 (first plot) and dx=16 (second plot), I find no relevant differences between implementing or not the dissipation, while the late time evolution of the system is strongly influenced by the choice of the resolution; compare
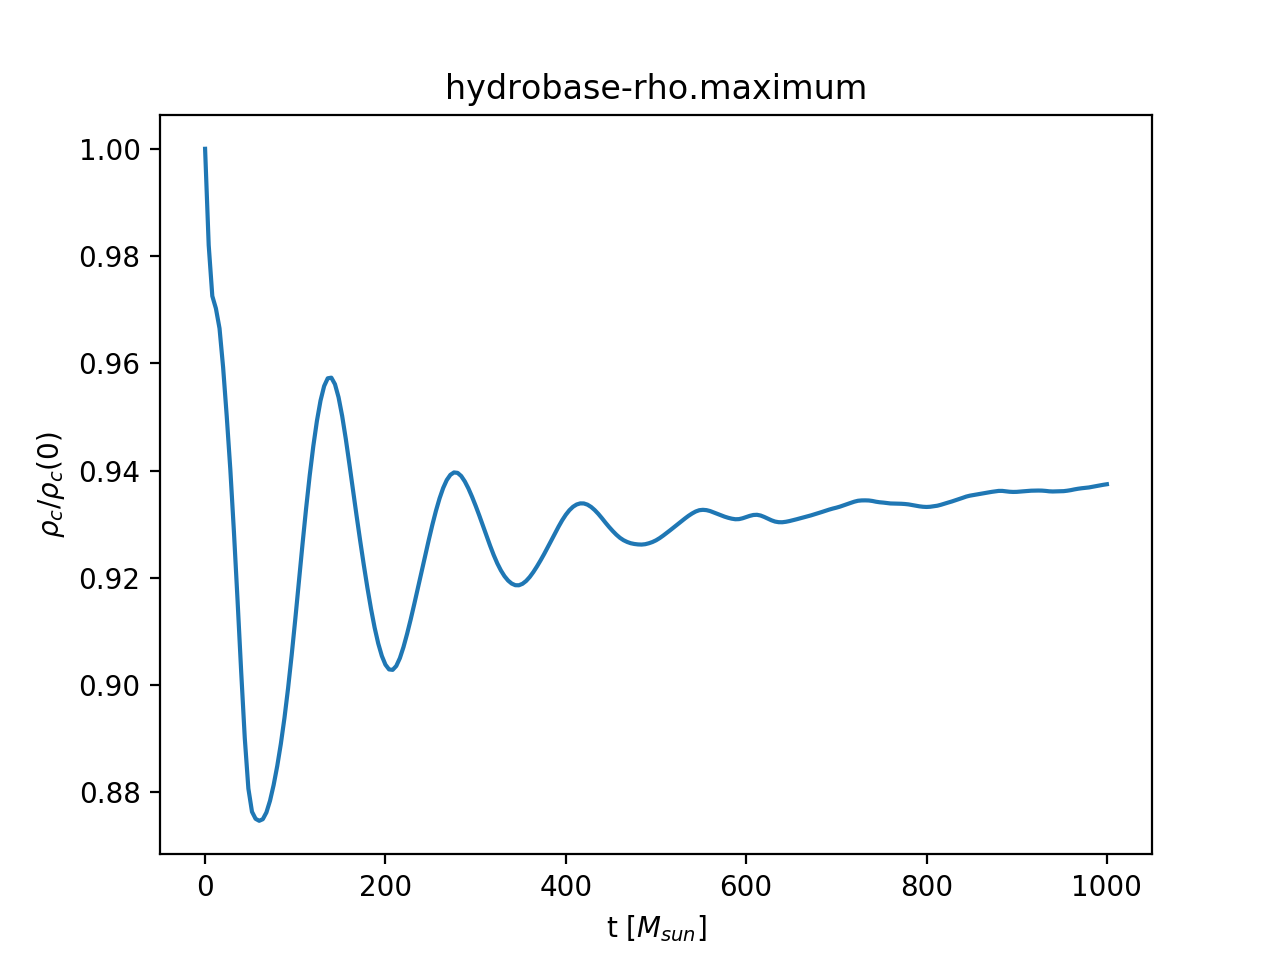
In both cases I don’t get anything like Figure 15 of the paper for the hydrobase density (HydroBase::rho). At this point I also used the same poison value from the original parameter file for a sanity check and got as output also the grhydro density (GRHydro::dens).
Using a resolution dx=16 I always get the same profiles for both the hydrobase and grhydro densities; see
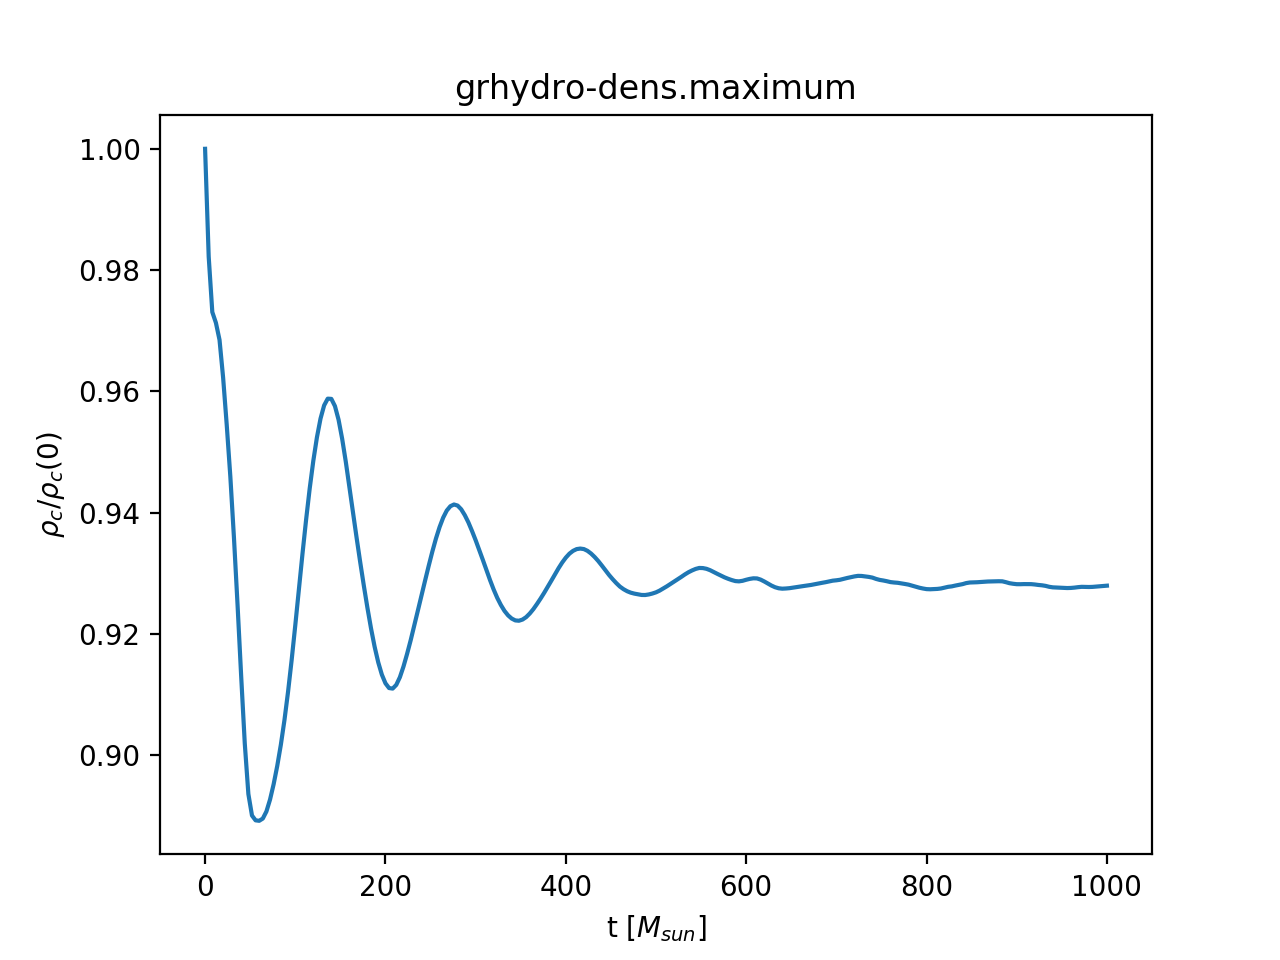
Also in this case a significant discrepancy is obtained between my results and those presented in the paper.
PS: what is the preferred praxis to upload parameter files to the report?
For reference, this is the plot for the three resolutions that Frank ran it for the paper (dx = 2,4,8):
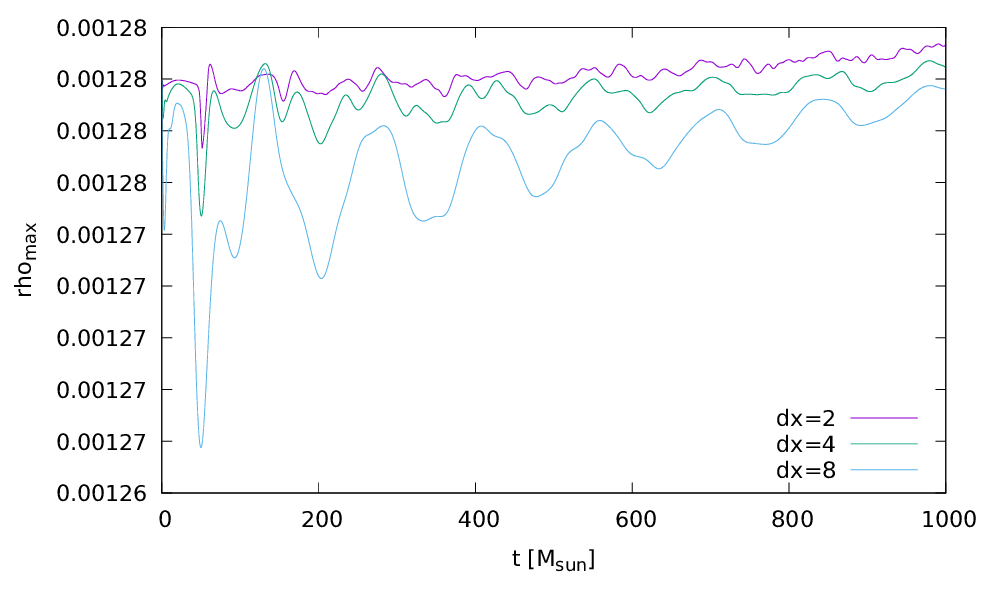
The plot in the paper is for dx=2.
These results do depend on resolution since we are not adding an explicit perturbation and thus the only perturbation away from the stable TOV solution is due to numerical errors when interpolating the 1D spherical data onto the Cartesian grid. This means that at high enough resolution the oscillations converge away as we approach the analytic solution which is stationary.
Thanks, Roland!
we did compare our data to the raw data corresponding to that plot for dx=8 and find large deviations (compare to the first plot in my message from 2019-04-19).
I have started to re-run the dx=8 parfile with older versions of the code. Maxwell (2011_10) reproduces the plot in the paper.
I will try and find the release where a change is visible.
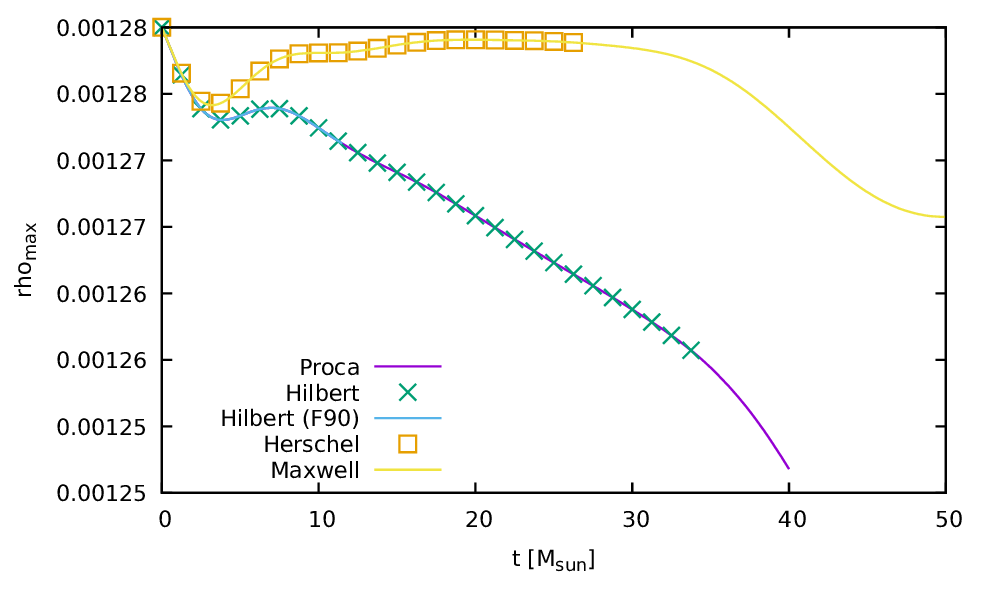
The change in behaviour happens in between the Herschel (ET_2014_11) which produces results identical to the paper and Hilbert (ET_2015_05) which produces results identical to Proca releases.
Hilbert is the release where GRHydro's default switched from F90 to C++ code. However that is not it as even running Hilbert with use_cxx_code = no does not recover Herschel's behaviour.
The issue is that Hilbert also changed how the derivative order for the Christoffels in the GRHydro source terms is set. This used to be via ADMMacros::spatial_order but became GRHydro::sources_spatial_order. This was already found to be an issue in #2119#2118
There is also some code in #2120
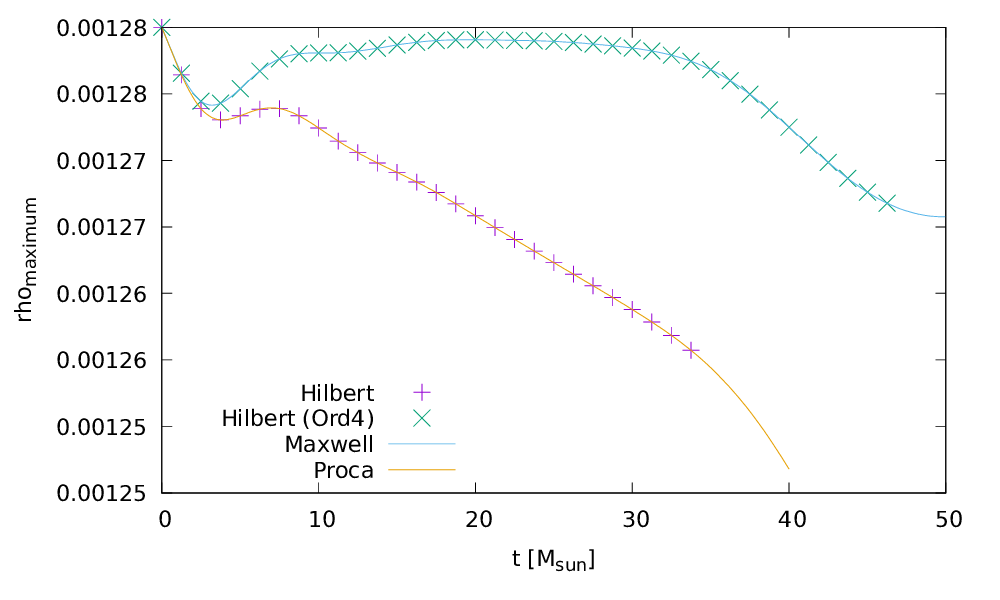
This is the result of adding:
GRHydro::sources_spatial_order = 4
thanks for tracking this down, and I agree with your change. I asked Giuseppe to repeat the gallery example with the updated parameter setting for the Proca release.
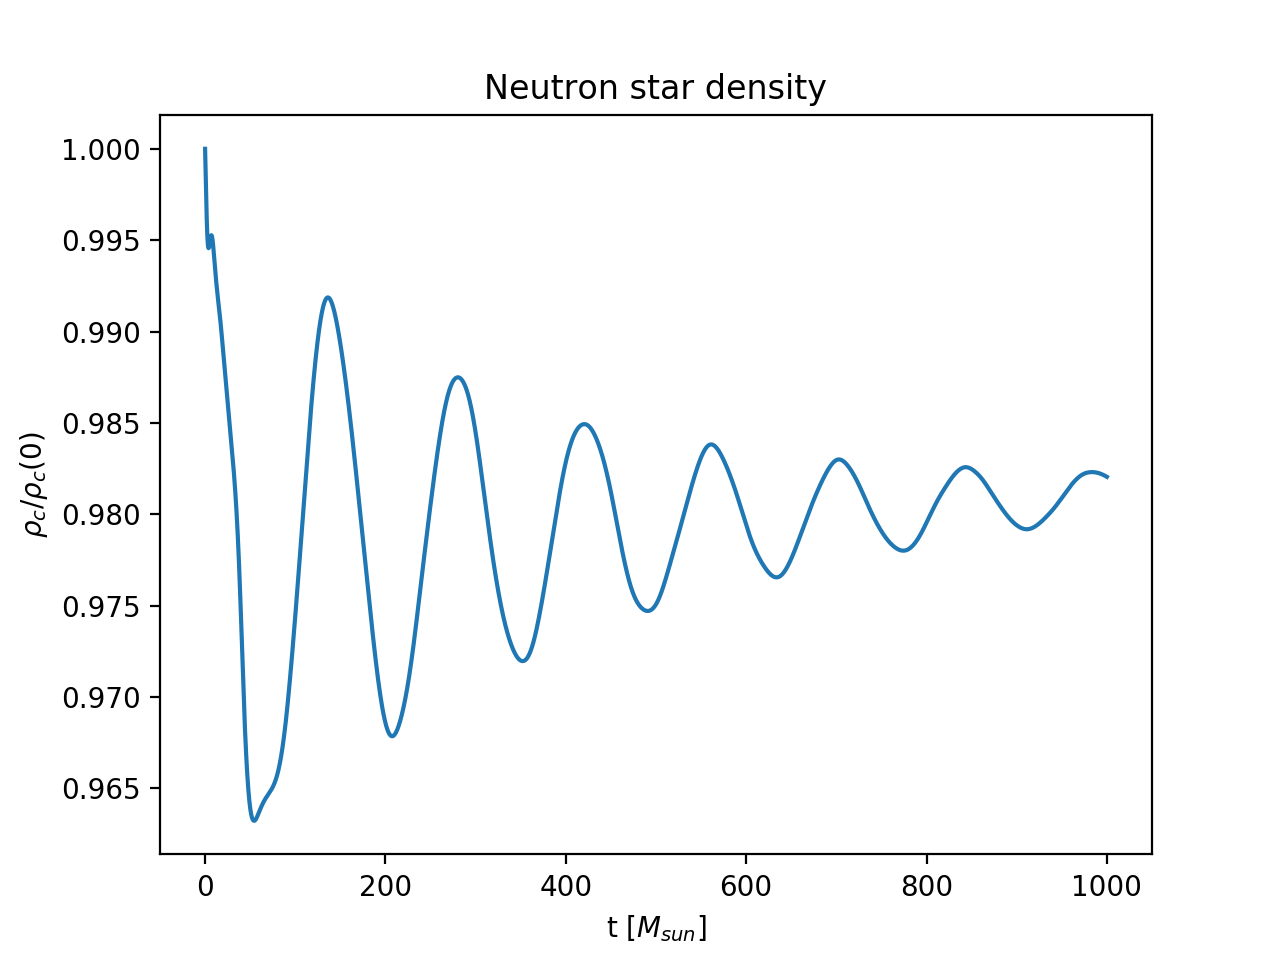
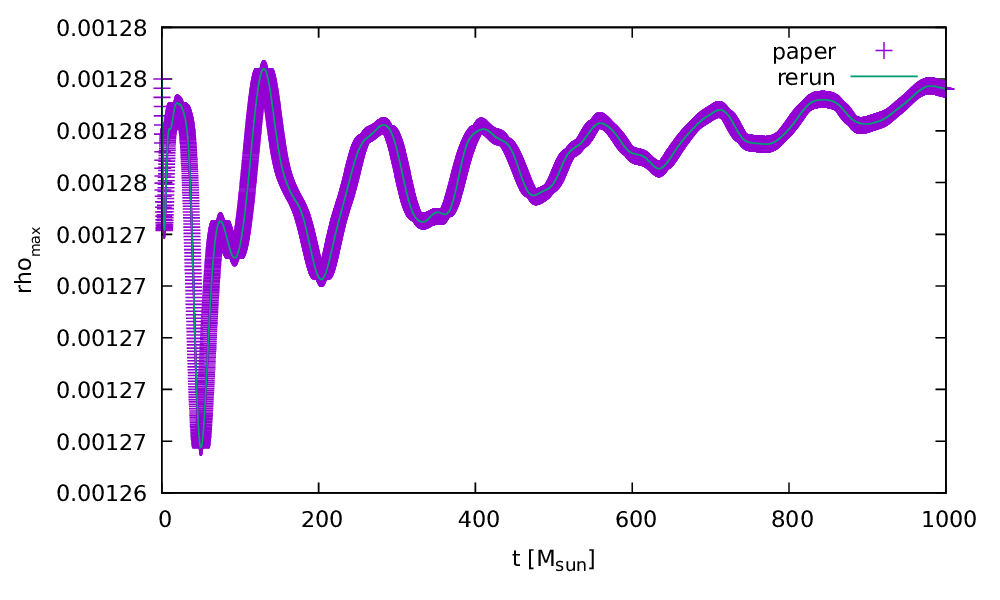
With the change GRHydro::sources_spatial_order=4 we do indeed recover the behaviour of the release paper (https://arxiv.org/abs/1111.3344 (Figure 15)) as shown below.
If you agree I will upload the data and a brief description to the gallery. Do we want to use the same setup with a smaller grid for the tutorial so that they are consistent?
Yes, please upload the new data to the website and the tarball to bitbucket. Yes, please, if you can do provide a lower resolution / smaller gird setup for use in the tutorial. You may want to have a look at the current one provided by Bruno which is very short and runs in 10 minutes or so (it has very low resolution and very small grid).
Done with the gallery example, please check. Thanks to Giuseppe!
OK, we’ll set up a small test for the tutorial.
Looks fine with one exception: I would not include the date of run in the parfile (mostly b/c none of the other examples do, partially b/c it may look odd in the next release if the parfile needs no change so should not change the name [it also makes change tracking in git a bit easier but not by much]).
agreed and done.
The gallery example “TOV star” was last successfully tested on 10 October 2019. The data is uploaded and the website description updated.
Opened for ET_2020_04 release.
Brockt Brendal (UIUC) will test this for 2020_04.

For the latest update, I ran this gallery example, “TOV star,” on 05-20-2020 and updated the results download and plot at http://einsteintoolkit.org/gallery/ns/index.html on 05-21-2020.
Thank you. Closing this task until the next release.
Miguel Gracia agreed to handle this for ET_2020_11

I ran the example, uploaded the files and updated the figure on index.html file for the ET_2020_11 release. The link to the Thornlist and name of the release still needs to be changed
Thank you!
Reopened for 20201_05 release

I have run the gallery par file with the current development version of the toolkit and get results identical to the previous release.
In today’s ET call, https://docs.einsteintoolkit.org/et-docs/Meeting_agenda#2021-04-29, the issue of adding presync parameters was discussed and it was decided to try adding:
Cactus::presync_mode = "mixed-error"
to all gallery parfiles.
I tried adding the presync_mode parameter and got an almost immediate abort:
WARNING level 0 from host DESKTOP-PLSCBCI.localdomain process 0
in thorn Carpet, file /mnt/e/diener/Cactus/configs/gallery/build/Carpet/PreSync.cc:260:
-> Required read for TMUNUBASE::eTtt (rl=0) not satisfied. Have Nowhere and require Everywhere missing Everywhere at the start of routine ML_BSSN::ML_BSSN_ADMBaseInterior. Current valid state:
Valid entries: TMUNUBASE::eTtt (rl=0) Nowhere TMUNUBASE::eTtt (rl=1) Nowhere TMUNUBASE::eTtt (rl=2) Nowhere TMUNUBASE::eTtt (rl=3) Nowhere TMUNUBASE::eTtt (rl=4) Nowhere.
cactus_gallery: /mnt/e/diener/Cactus/configs/gallery/build/Carpet/helpers.cc:275: int Carpet::Abort(const cGH*, int): Assertion `0' failed.
After a bit of investigation it appears that the schedule.ccl file for ML_BSSN contains erroneous read declarations for the stress energy tensor from TmunuBase. Tmunu is not necessary for converting from BSSN to ADM variables. I believe this is generated by Kranc. I still tried to comment out these read declarations and rerun and found agreement to within roundoff errors with the gallery files. I will open a separate ticket for this issue.
Peter Diener will handle this for ET_2021_11

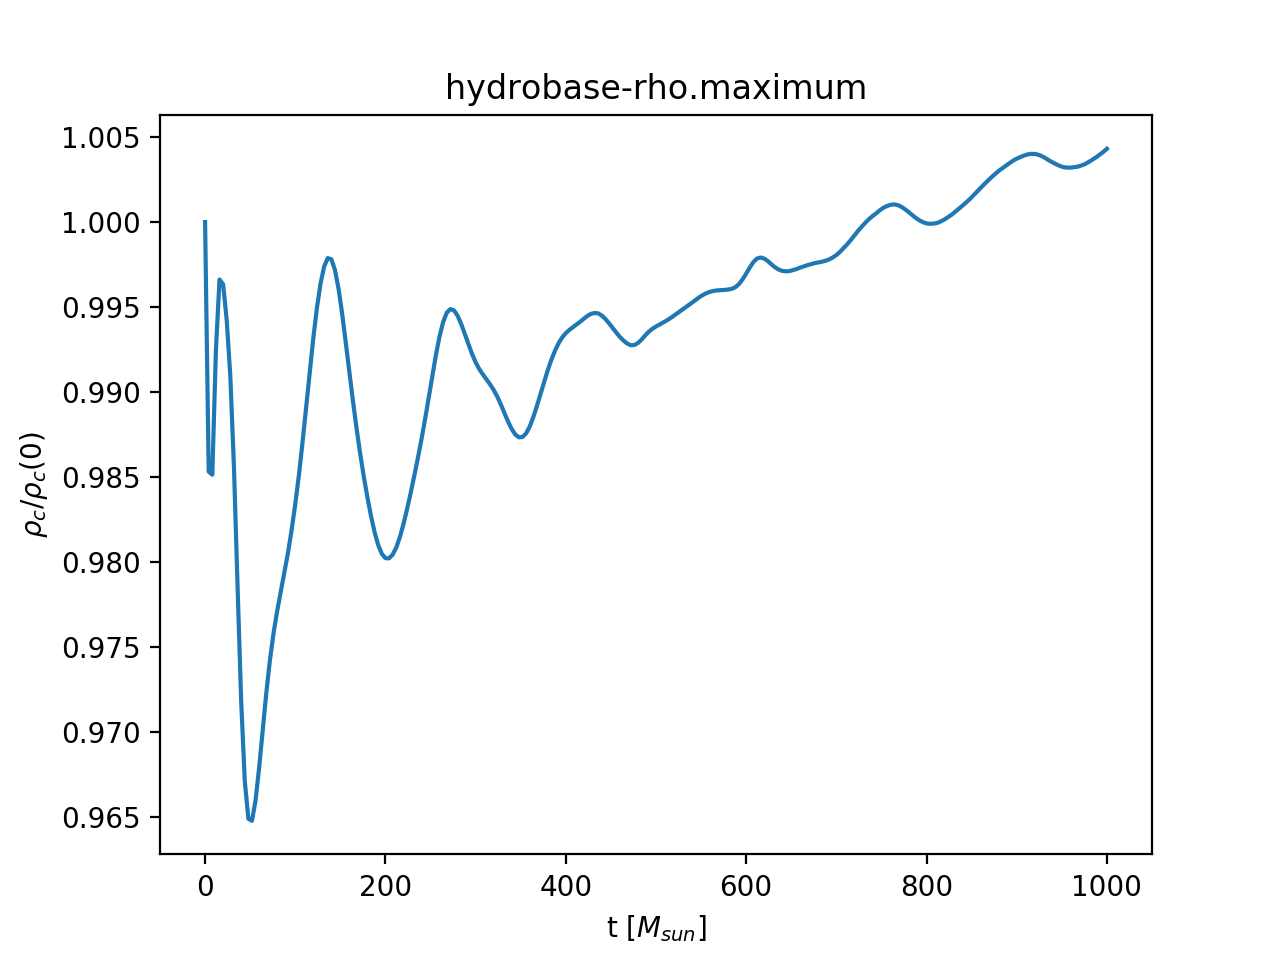
The kuibit code to reproduce the plot should be something like (not tested):
from kuibit.simdir import SimDir
import matplotlib.pyplot as plt

PATH = ....

rho = SimDir(PATH).timeseries.maximum['rho']

plt.plot(rho / rho(0))

plt.savefig("density.pdf")
I have run the tests successfully and updated gallery web page with the new data, plot and kuibit script.
Done for the November 2021 release.
@Leung, Lisa Jing agreed to handle this for 2022_11.

Did you already have time to look at the gallery example?
Not yet, will look at and (hopefully) submit my result some time after midnight today
Ran and uploaded result on 10/26/2022 with latest update, maximum density plot looks consistent with 5/12/2022 result
Updated webpage with updated image files and compressed result folder
Thank you. I am closing the ticket until the next release.
@Peter Diener will handle this for ET_2023_05
I have rerun the gallery simulation and found no difference between the new results and the old ones. I also ran at three higher resolutions and have added that data to the new plot. I have also added a convergence plot using the three highest resolutions. The Kuibit script has been update to produce both the density and the convergence plots.

@Peter Diener Can you close this ticket once you’ve uploaded the new data and updated the website?
@Peter Diener will handle this for ET_2023_11


Maxwell updated the website and tar file. Thank you!
@Peter Diener did you already have a chance of archiving your (older, ET_2023_11) gallery run data to upload to https://bitbucket.org/einsteintoolkit/www/downloads/ ?

@David Boyer will run the test for 2024-11
@Roland Haas I have run the gallery example and everything looks good, same outcome as before. The new runs are tarred up and ready to go. However, I have also rerun the test with the new gauge settings from ticket #2520 (also in the current dev. version), and now since I know what I need to do, I could upload those instead if you like, taking out both tickets at the same time. Would this alternative be preferred?
uploading only the new one should be sufficient. Maybe add a comment to #2520 that before you updated the parfile everything looked the same as before to document that the change observed is only due to the changed gauge.
@Roland Haas I’m trying to upload the results to https://bitbucket.org/einsteintoolkit/www/downloads/, but it’s saying I don’t have write permission and won’t let me upload. It looks like I still don’t have write permission.
@David Boyer could you try again please? Also updating the web-page, please?
@David Boyer could you try again please? Also updating the web-page, please?
@Roland Haas Thank you for the ping. I got some help and was able to create a pull request with the new additions + updated index.html. Please review.
I’ll also make sure I update the other ticket as well.

Tested on 2018-07-31 using my Linux workstation and gcc 8 and 1 core (1 rank, 1 thread). Updated figure on website, provided tarball of results. Results look visually close to what was there before though there was no numerical data provided.
I do however see failures if I ran the test with 12 MPI ranks (1 thread each) which is a bug and I am following up on it.