

- removed comment
I still have the problem that my BNS runs consume increasing memory during inspiral, where regridding happens. It limits the runtime of typical BNS runs to around 1 day, then they are killed by memory exhaustion. After merger, with fixed grid structure, the problem goes away. It happens with two different codes, WhiskyThermal+McLachlan and WhiskyMHD+McLachlan, on all clusters I use (hydra, marconi, supermuc, fermi, ..), and all releases I used: Payne, Brahe, Tesla, Wheeler. Regridding controled using CarpetRegrid2.
Keyword: None
Wolfgang, can you identify a small par file for me which illustrates the problem?
Confirmed using valgrind. The memory allocated on line 148 of ggf.cc is not freed.
139   // Resize structure and allocate storage
140   storage.resize(h.mglevels());
141   for (int ml = 0; ml < h.mglevels(); ++ml) {
142     storage.AT(ml).resize(h.reflevels());
143     storage.AT(ml).AT(rl).resize(h.local_components(rl));
144     for (int lc = 0; lc < h.local_components(rl); ++lc) {
145       int const c = h.get_component(rl, lc);
146       storage.AT(ml).AT(rl).AT(lc).resize(timelevels(ml, rl));
147       for (int tl = 0; tl < timelevels(ml, rl); ++tl) {
148         storage.AT(ml).AT(rl).AT(lc).AT(tl) = typed_data(tl, rl, lc, ml);
149         storage.AT(ml).AT(rl).AT(lc).AT(tl)->allocate(
150             d.light_boxes.AT(ml).AT(rl).AT(c).exterior, dist::rank());
151       } // for tl
152     }   // for lc
153   }     // for ml
154
Regridding is supposed to happen as follows: 1. Memory for the new grid structure is allocated 2. As much as possible, data are copied from the old to the new grid structure 3. Where necessary, data are interpolated from the old to the new grid structure 4. The old grid structure is freed
The routine which you list is step 1, allocation. Deallocation is supposed to happen in step 4 in a function called recompose_free_old. When Cactus terminates, then the memory for the current grid structure is deallocated in a function recompose_free.
Please see also this old discussion on how to track down memory leaks: http://lists.einsteintoolkit.org/pipermail/users/2014-May/003611.html where eg Google's perftools https://code.google.com/p/gperftools/ are mentioned which also has some heap checker build in. There is also a home-grown memory tagger (an attachment to one of the emails) that lets you answer questions like: "right now, who allocated how much memory" which you can use to tag memory allocations to find out if some allocates are never freed (there's no need to explicitly match up allocate / free).
I had a look at it and the increase in memory usage was (at least in the example parfile that is attached to this ticket), not due to grid functions.
Digging a bit deeper I found that CarpetLib's commstate objects never free memory allocated for their communication buffers (the procbuf objects), and instead retain that storage in a class static variable (to avoid constantly allocating and freeing it for every single group in a SYNC statement).
This effectively means that the size of procbuf can only ever grow and eg if a large procbuf is needed during recomposing (re-distributing data after regridding) then that large procbuf stays around even if a "regular" SYNC (ie. a ghost zone sync and prolongation) would need much less storage for the communication buffers.
I have tested this guess by editing comm_state::procbufdesc::reinitialize in commstate.cc to read:
  // Note: calling resize(0) instead of clear() ensures that the
  // vector capacity does not change
#if 0
  sendbufbase.resize(0);
  recvbufbase.resize(0);
#else
  {vector<char> empty; sendbufbase.swap(empty);}
  {vector<char> empty; recvbufbase.swap(empty);}
#endif
so that storage is actually freed (note that a call to clear() would not guarantee to free storage either, contrary to what the comment may imply, see http://www.cplusplus.com/reference/vector/vector/clear/).
So there is no memory leak in the sense that no memory is lost and all memory is properly accounted for by Carpet. There is also an upper bound on how much storage the procbufs could take (though that max may be on the size of a full refinement level for the largest group of variables). However there can clearly be an increase in storage used if a minor change in grid structure (as what happens in iteration 2048 of the example, where box 3 just changes size a bit, it existed before already) can lead to a large amount of data needing to be communicated (maybe b/c the assignment of patches to ranks changed).
My change is probably not what one wants to keep in the code (since the comment indicates that the original author did not want to free/allocate the buffers all the time), but a change that only frees the buffers after a regrid would seem useful to me (and not hard to implement I hope).
Pull request is here: https://bitbucket.org/eschnett/carpet/pull-requests/23/rhaas-commstate-free-buffers/diff
This pull request frees memory in the communication buffers after a regrid operation under the assumption that a regrid will change the communication pattern thus requiring differently sized communication buffers.
Is anyone (eg the persons who were affected by the memory usage) willing to review this patch? Wolfgang, Miguel?
another simple parameter file that shows this issue
i've finally found some time to give this a try.
from my very brief test, though, i think i'm seeing the same sort of behaviour with and without this commit (i've checked the current branch ET_2019_03 vs the branch rhaas/commstate_free_buffers). memory usage as reported by systemstatistics for the simple run ML_QC3_memcheck.par with and without the commit looks the same in both, and it resembles what i had observed before (though now i’ve performed a much shorter run) in that the memory increases a lot after regridding. am i not looking at the right things, or should i be looking at longer evolutions?
memory increase plot
I am trying to perform a simulation of fragmentation of a differentially rotating star. The simulation is rather large and expensive, and it is severely affected by this bug. In the simulation I have three centers of refinement with 13 refinement levels. Initially I have only 8 refinement levels active, and I dynamically increase the number using the Trigger thorn. I move two of the three centers dynamically as well. I can see a steady increase in the memory used, but I can complete the simulation using many nodes and running for at most six hours (in fact, the memory requirement is reset after a checkpoint). Now, I changed initial data and I slightly modifies the grid by mainly changing resolution and scaling everything up by a factor of five. With this new set up, the memory leakage is so serious that makes the simulation impossible. My quick tests seem to indicate the the memory requirement increases by a factor of two in less than 512 iterations. No matter how many nodes I use, I could not run for more than 45 minutes. I am running on Blue Waters, up to 60 nodes, up to 64 GB of memory per process. I tried all the version from 02_18 to the latest, and also the branch rhaas/commstate_free_buffers. Is there anything I can do to help debugging/fixing this problem?
Hello Gabriele, I am currently at the BW symposium. If you could attach the parfile and let me know the bw job id on bw that would be great. On bw I can get (even for finished runs) a per minute timeseries of the allocated memory.
Hi Roland,
I thought I had replied to your question, but I don’t see my comment here, so I’ll post it again.
I just submitted a new run with job id 10009628.bw that was killed by the OOM daemon in less than 1 hour.
As for the parameter file, I am attaching it here, but it relies on some thorns/modifications I made (chiefly the initial data), and so you will not be able to run it. In case you want to run it, I can probably tweak the parameter file/provide you with the needed codes.
Thanks for looking into this,
Gabriele
I don’t know how to attach files in these tickets so I put the par file here: https://pastebin.com/vF9Gxm3U
You can attach files by clicking on the “More” button on the top right of the issue display under the “Create Issue” button (not in the areas where you edit your comment, but at the very top of the browser window).
Would you perhaps have a newer run? 10009628.bw is older than the window (3-4 days) over which we (can) keep detailed information available online. Getting to the offline information requires parsing ~1TB of log files and is a bit slow because of this.
Yes, I have just re-submitted the same job. The new ID is 10041986.bw.
You can attach files by clicking on the “More” button on the top right of the issue display under the “Create Issue” button (not in the areas where you edit your comment, but at the very top of the browser window).
Thanks, that was not intuitive.
Actually job 10041986.bw. failed because I ran it with the wrong configuration. The correct id is: 10043980.bw.
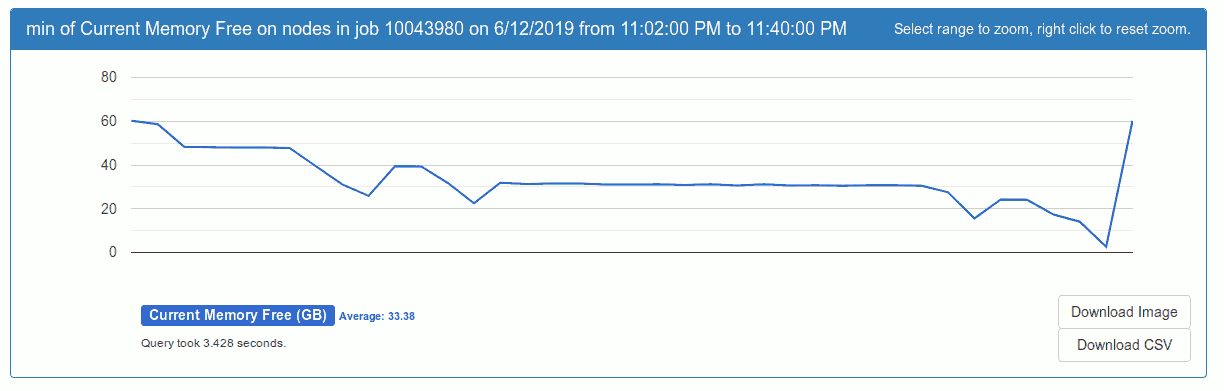
Here’s a plot of the minimum amount of free memory on the nodes. The dip at the end is at 23:39 PM CDT
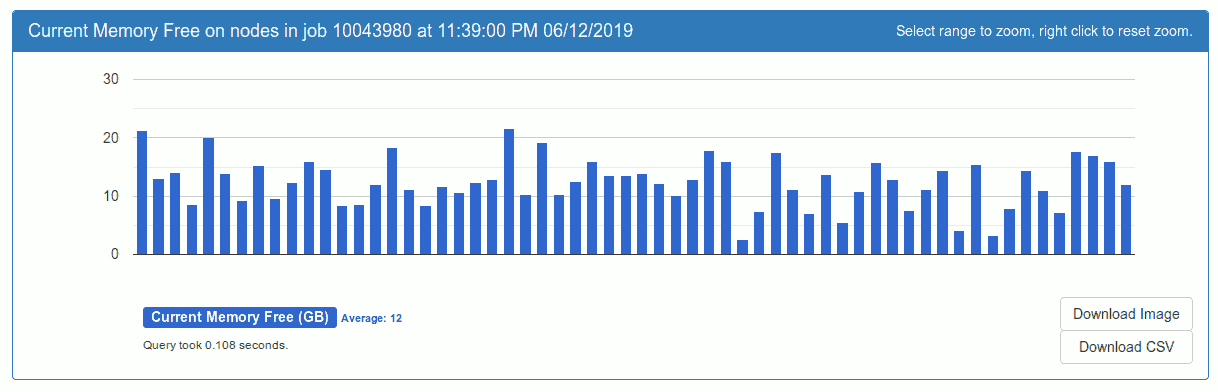
 This job used 60 nodes and free memory over nodes at the low point at the end looks like this
 at the last regrid Carpet reported
Global grid structure statistics:
GF: rhs: 51465k active, 62017k owned (+21%), 74843k total (+21%), 23.8 steps/time
GF: vars: 425, pts: 102690M active, 122091M owned (+19%), 150113M total (+23%), 1.0 comp/
proc
GA: vars: 1115, pts: 38M active, 38M total (+0%)
Total required memory: 1198.488 GByte (for GAs and currently active GFs)
Load balance:  min     avg     max     sdv     max/avg-1
Level  0:     108M    117M    130M      5M owned     10%
Level  1:     157M    160M    164M      2M owned      2%
Level  2:     168M    172M    175M      2M owned      2%
Level  3:     189M    193M    194M      2M owned      1%
Level  4:     235M    240M    244M      2M owned      2%
Level  5:     283M    296M    308M      9M owned      4%
Level  6:     356M    412M    440M     25M owned      7%
Level  7:     436M    444M    449M      3M owned      1%
which is less than 50% of the total amount of available memory (~60GB per node totalling to 3600GB for 60 nodes).
The memory usage is very uneven which explains why even though the total is not very high, one node ran out of memory.
Hi Roland,
thanks for looking into this.
Is there any knob I can turn to fix the load balancing?
Gabriele
Carpet should load balance the grid functions on its own, I am not aware of any knobs. It is still possible that the uneven memory usage is not due to grid arrays (which is the only thing Carpet reports on) but eg due to communication buffers (though the unevenness is quite extreme). There are 2-3 nodes that have much less free memory than the others. If it had only been a single one I would have suggested checking memory use on rank 0 (which often does “extra” work), but with 3 affected that seems less likely.
I will be busy until after the RIT meeting so likely will not look into this any further until after the meeting is over, sorry.
Okay, thanks for the assistance.
Even though https://bitbucket.org/eschnett/carpet/pull-requests/23/rhaas-commstate-free-buffers/diff does not seem to fix all issues reported here, it did help at least in one case on my workstation running Miguel’s example. As such I would like to commit it after 2019-07-13 .
I gave ML_QC0.par a test run using 6 MPI ranks. I used either the Proca release code or Proca with Carpet set to rhaas/commstate_free_buffers instead.
With this I observe a change in allocated memory at the regrid in iteration 2048.
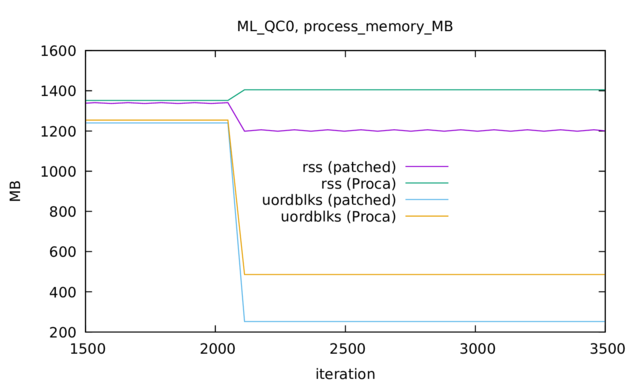 In the plot there are two fields of systemstatistics' output shown.
 max_rss which is the amount of memory currently claimed from the OS and which includes memory already free()ed but not yet returned to the OS. uordblks instead (see man mallinfo) is the amount of memory currently allocated via malloc (and new etc). The plot shows that applying the patch does (a) reduce the amount of memory malloc’ed on the rank with the largest such value decreases which is what should happen once one frees communication buffers and (b) that this apparently is enough to convince free() to return memory to the OS (drop in RSS). (b) is not something one can guarantee since memory fragmentation can prevent this since memory must be returned to the OS as hole pages (or worse as a whole chunk if mmap was not used to request it but setbrk).
I will try and see if there are differences i n ML_QC3 as well and maybe if there are differences late on in the ML_QC0 run as well.
I have not tested @Gabriele Bozzola 's files (yet) because they require an actual run with a number of nodes on Blue Waters.
@Miguel Zilhão do you see a drop in rss after it=2048 in your test run or no change at all? Note that rss is not really controllable by user code (since it depends on when free() returns memory to the OS) and that all one can really do is control uordblks by calling free().
I would be very careful interpreting the SystemStatistics memory information. From what I know, the mallinfo data structure from glibc is not even 64-bit safe (the ints are 32 bit). Much better, if you really want a reliable way to see what is happening, would be to use tcmalloc, and then output the diagnostics it provides. I wrote a tcmalloc wrapper thorn which outputs the diagnostics to files during a Cactus run (https://bitbucket.org/ianhinder/tcmalloc/src/master/). The thorn doesn’t install tcmalloc for you, so you have to do that yourself, but it’s fairly easy (you do need libunwind as a dependency). The thorn has a parameter to force tcmalloc to release memory back to the OS after each regridding.
LDFLAGS = -rdynamic -L/home/ianhin/software/gperftools-2.1/lib -Wl,-rpath,/home/ianhin/software/gperftools-2.1/lib -ltcmalloc
This should be sufficient for tcmalloc to be used instead of glibc malloc.
Also note that a high maxrss is not necessarily a problem; it might just mean the OS didn’t need that memory yet, and therefore hasn’t unmapped it.
tcmalloc is indead the better solution to this and may well actually take care of your out-of-memory situation altogether. It is very easy to install and can be used as well on clusters. In the past we have also found that running with tcmalloc can give a noticeable speedup for some codes compared to running just with glibc (a speedup measurable in the physical_time_per_hour measurement, though the code was not actually Cactus based).
Having said this, that is also the reason why I did not use it for this test since I wanted to see if I can still get the increase in rss (which does not come from mallinfo but from reading /proc so is "safe") before/after the patch. In this case I think mallinfo() is still trustworthy since I am running with less than 2GB per rank anyway.
I think I have another instance of this bug with a completely different parameter file (but same machine/compiler). I am performing a simulation of head-on collision with moving grids. Initially Carpet says that the required memory is 235 GB, and this goes down to 180 GB as time goes on (as I would expect, since the grids are colliding). Then, the simulation is killed due to the lack of memory. The job IDs on blue waters are 10105916.bw and 10106827.bw (the second restart, when the simulation crashes).
Roland’s conclusion was that Carpet is correctly allocating and freeing memory, but that memory is becoming fragmented. I talked to Brian O’Shea, and he said his code, Enzo, was also vulnerable to memory fragmentation, and probably most AMR systems have this weakness. Redesigning the system so that memory compacted is probably not feasible. However, if the plan to switch to AMReX goes forward, the problem will likely solve itself, as AMReX appears to take this sort of issue into account.
Unless anyone can propose a solution to this problem, we will mark this as not fixed.
See last comment. This problem seems to be caused by fragmentation of memory due to malloc/free and cannot be fixed.
Sorry I didn’t see this before it was closed. I would suggest that you first confirm that the problem is due to fragmentation. glibc malloc is fairly useless for this. I propose
When I looked into this again in 2018 (I had previously tried to debug the problem for my own runs years before), the tentative conclusion did seem to point to fragmentation (see http://lists.einsteintoolkit.org/pipermail/users/2018-August/006434.html). But this was never fully confirmed. There were also hints that allocated memory was increasing, even though memory allocated for gridfunctions was not. So before concluding that fragmentation is the reason, it would be good to see a clear demonstration of this. If fragmentation is the reason, use of tcmalloc might reduce fragmentation, and there are parameters and strategies you can use to help.
My own solution to the problem was to run shorter jobs between checkpoints, so that the memory didn’t grow too high before the job checkpoint-terminated.
This never made it into the ticket apparently: I tried the first test case ML_QC0.par (https://bitbucket.org/einsteintoolkit/tickets/issues/attachments/2194/einsteintoolkit/tickets/1549060822.72/2194/ML_QC0.par) with tcmalloc and compared to tot plot in https://bitbucket.org/einsteintoolkit/tickets/issues/2194/memory-increase-during-regridding?detectloginloop#comment-52821439 it actually made things worse.
So at least for the workstation sized qc0 example using tcmalloc did not help (made things worse instead). jemalloc may improve things but improvement seems to be hit-or-miss and not anything that we can actually fix.
The memory held by Carpet itself could in fact be defragmented at runtime as Carpet already has a mem class that can keep track of all allocated buffers and provides the required level of indirection. Whether it would actually help the issue is not clear though since there is memory allocation outside of Carpet that does not use the mem objects.
Which quantity was worse?
In the plot that I linked to: rss. Please note that the job was constructed such that each process used less than 2GB of RAM so mallinfo's rssnumber is trustworthy. The other quantity plotted uordblks plotted is the amount of memory that malloc handed to its client code and that (thankfully) went down with the patch that free()ed the temporarily allocated procbuf buffers.
There is also the issue that during a regrid Carpet will genuinely use more memory. If I understand its code correctly then it can use up to “old grid” + “new grid” + “procbuf”, where procbuf can be as much as the larger of “old grid” or “new grid”. At least the operations normally happen in a group-by-group and level-by-level manner, so that not two copies of the full state vector of all variables are required.
I’m skeptical about RSS. I’ve seen processes grow in RSS until it reaches max memory, and then run perfectly happily while RSS remains flat. My impression is that pages are not actually being returned to the OS until there is a need for them. So, painful as it might be, I would run your test until you reach the point that the actual problem occurred; i.e. the OOM.
I guess the way to think about this is that “high” RSS alone is not sufficient for an OOM event, however it wold seem necessary. On clusters like BW that have no swap and for codes like Cactus that have little IO that could be cached in memory (and no explicitly mmaped region) it likely is highly correlated though.
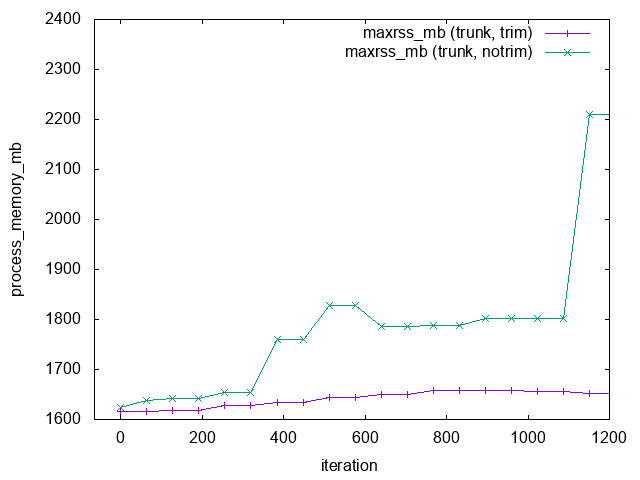
I ran ML_QC3_memcheck.par using 8 MPI ranks and either the Proca code or current (pre ET_2020_04) master to check the effects of the patch (which is in master but not in Proca).
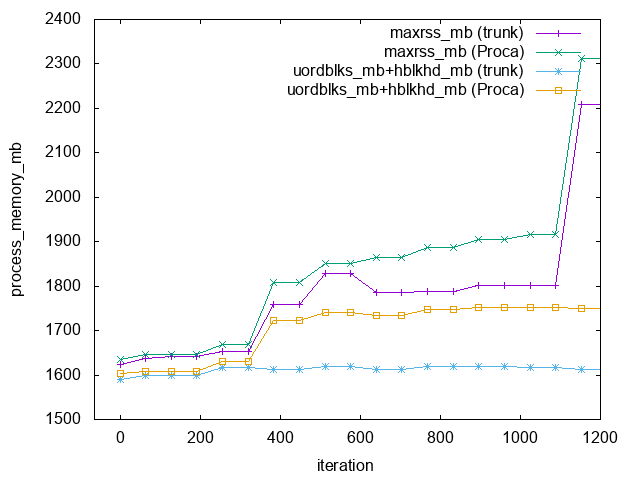 Clearly the patch reduces RSS compared to Proca but does not avoid the jump at around it=1096.
I ran the “trunk” code once more, this time advising malloc to return memory to the OS as soon as possible by setting MALLOC_TRIM_THRESHOLD_=0and MALLOC_TOP_PAD_=0 (see man mallopt) and this reduces RSS significantly:
 For glibc (ie GNU/Linux, no tcmalloc, no jemalloc) one can use the function
 malloc_trim to do the same thing. A solution without having to modify code is to set the two variables mentioned above in your RunScript:
export MALLOC_TRIM_THRESHOLD_=0
export MALLOC_TOP_PAD_=0
I think this is the same as what happens when using tcmalloc and explicitly releasing all excess memory after regridding (see my tcmalloc thorn). But what I really want to know is whether this addresses at all the original problem of runs crashing with OOM. Do you have a test case that crashes with OOM that you can run?

See also this thread: http://lists.einsteintoolkit.org/pipermail/users/2018-August/thread.html#6417. (Line wrapping problematic on the mailing list archive page as usual, which I believe is caused by a bug in Apple Mail).